Understanding The Demand Supply Curve; The demand and supply curve is a fundamental concept in economics that helps to explain the behavior of buyers and sellers in a market. The curve shows the relationship between the price of a good or service and the quantity that consumers are willing and able to buy, as well as the quantity that producers are willing and able to sell.
The demand curve represents the behavior of consumers. It is downward-sloping, indicating that as the price of a good or service increases, the quantity demanded decreases. This is because consumers will generally want to purchase less of a good or service as its price becomes more expensive. The inverse relationship between price and quantity demanded is known as the law of demand.
The supply curve represents the behavior of producers. It is upward-sloping, indicating that as the price of a good or service increases, the quantity supplied also increases. This is because producers are more willing and able to produce and sell a good or service at a higher price, as it allows them to cover their costs and earn a profit. The direct relationship between price and quantity supplied is known as the law of supply.
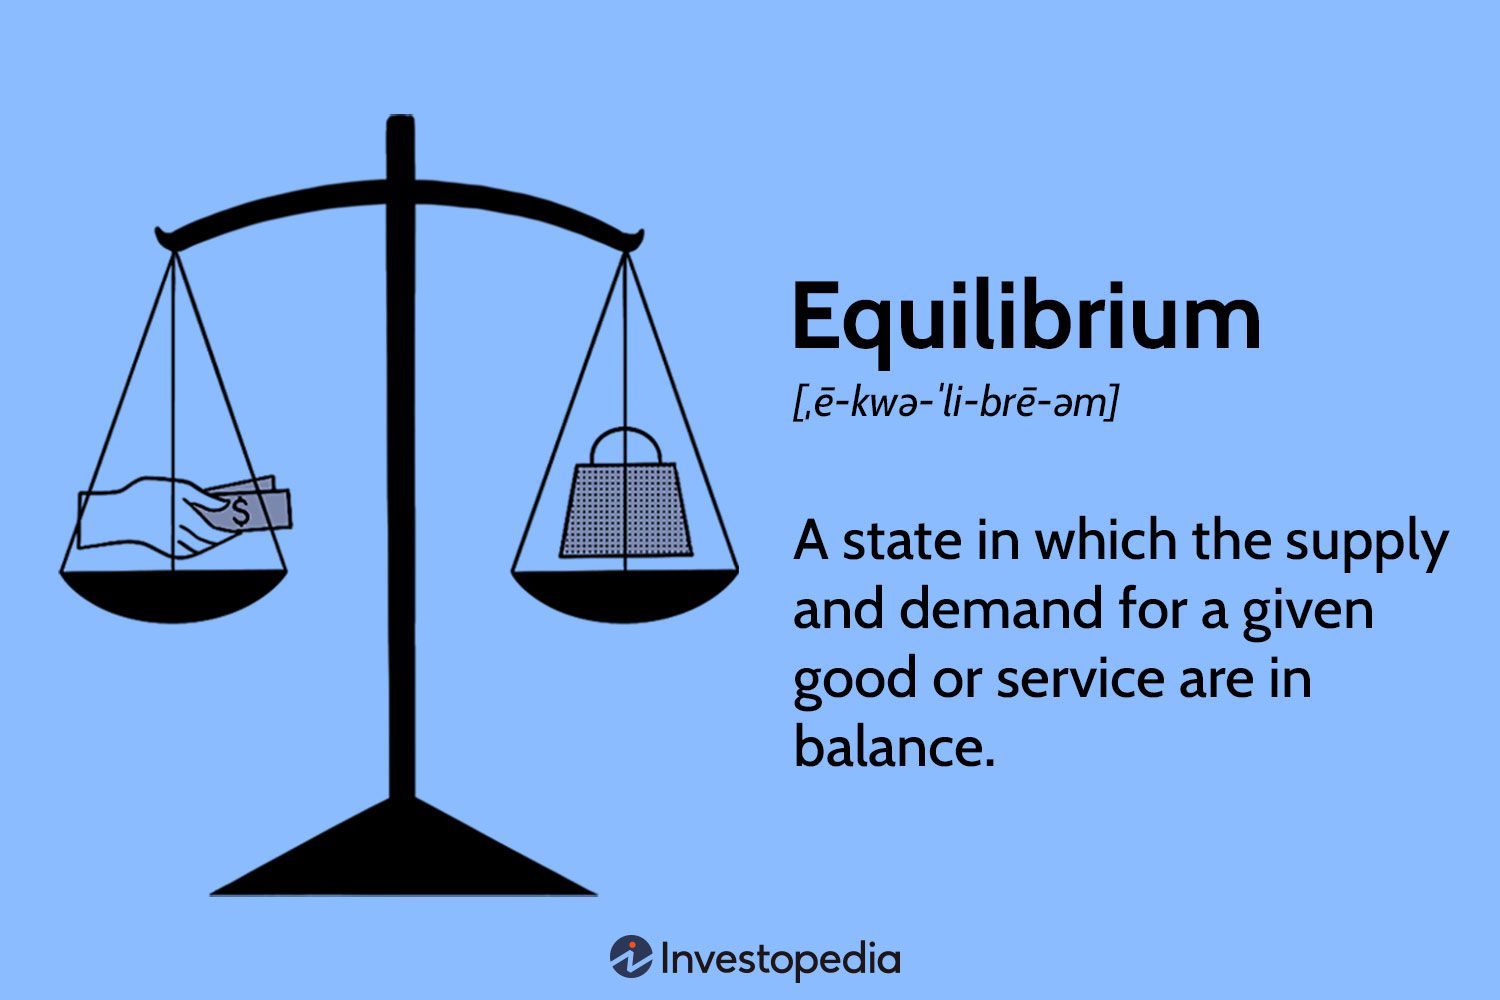
The point at which the demand and supply curves intersect is called the equilibrium point, where the quantity demanded equals the quantity supplied. This is the market-clearing price, as at this price, all buyers are able to buy what they want, and all sellers are able to sell what they want.
The equilibrium point in economics is where the demand and supply curves intersect. This point represents the market-clearing price and quantity, where the quantity demanded equals the quantity supplied. At this point, there is no excess supply or demand, and the market is said to be in a state of equilibrium.
The equilibrium point is important because it helps to determine the price and quantity of goods and services in the market. At prices above the equilibrium price, there will be a surplus of goods and services as producers will be producing more than what consumers are willing to buy. This leads to downward pressure on prices as producers try to sell their excess supply. On the other hand, at prices below the equilibrium price, there will be a shortage of goods and services as consumers demand more than what producers are willing to sell. This leads to upward pressure on prices as consumers bid up the price to acquire the goods or services they desire.
Another important concept related to the equilibrium point is market efficiency. In an efficient market, the equilibrium price and quantity represent the most efficient allocation of resources because all goods and services are being produced and consumed at the highest value to both buyers and sellers. Any deviation from this equilibrium point would imply that there is a misallocation of resources, leading to inefficient outcomes.
Changes in either demand or supply can shift the curves, leading to changes in the equilibrium price and quantity. For example, if demand increases, the demand curve shifts to the right, and the equilibrium price and quantity both increase. Conversely, if supply decreases, the supply curve shifts to the left, and the equilibrium price and quantity both decrease.
When dealing with the demand and supply curve, there are several key areas that one should note to understand how markets work and how changes in the economy can impact prices and quantities of goods and services. These key areas include:
Overall, understanding the demand and supply curve is crucial for understanding how markets work and how changes in the economy can impact prices and quantities of goods and services.
Want to explore the world of cryptocurrency and see what’s really going on behind the…
1. Introduction to the Text Title: Betrayal in the City Author: Francis Imbuga (Kenya) Genre:…
Brief Context Author & Publication: Written by Nigerian author Osita (Osi) Ogbu, the novel was…
Step into a deeper understanding of faith, values, and biblical truth with Musinguzi John Paul,…
Are you ready to unlock your business potential and become a future innovator, job creator,…
Step into the future of farming, food security, and environmental stewardship with Alinda Violet, your…
View Comments
Awesome! Its genuinely remarkable post, I have got much clear idea regarding from this post